
Births and deaths
Births and deaths are key components of population change and help us understand how communities grow, age and evolve over time. The Office for National Statistics releases counts of the total number of registered births annually and deaths monthly. A registered birth records the legal registration of a live birth, while a registered death records the legal registration of a death.
The number of births in a given year is influenced by fertility rates and the size and age profile of the population, particularly the number of women of childbearing age. The number of deaths registered each year is influenced by the size and age profile of the population, mortality rates, and wider factors affecting health and life expectancy. For more information about births and deaths, please see our fertility and mortality articles.
The latest annual birth figures are for 2025. The monthly death figures have been summed for the 2025 annual figure.
Key findings
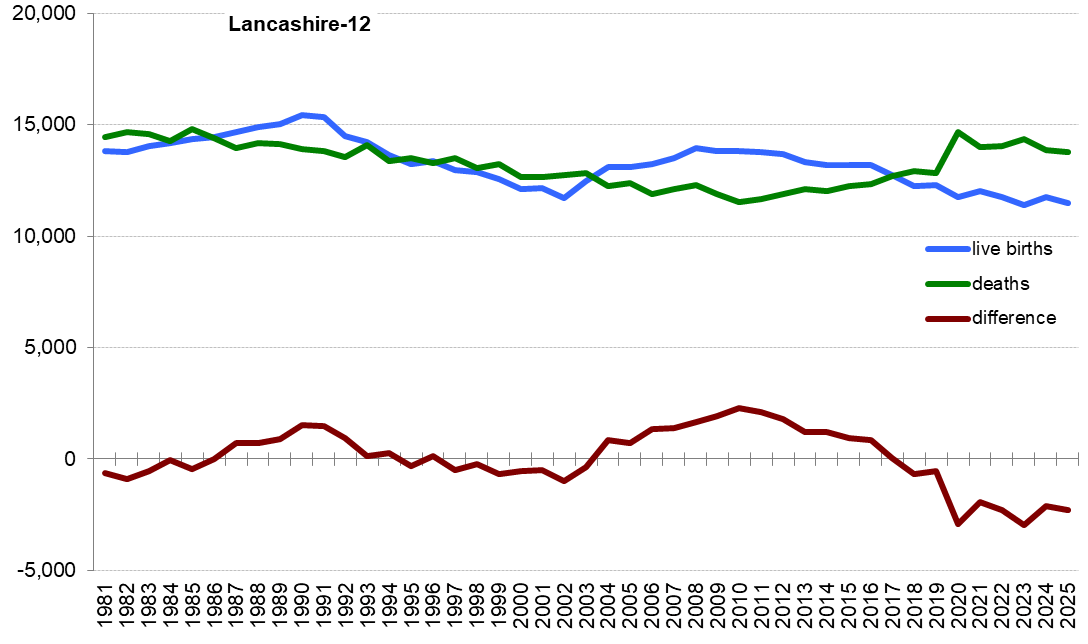
There were 11,490 births and 13,788 deaths registered in the Lancashire-12 area.
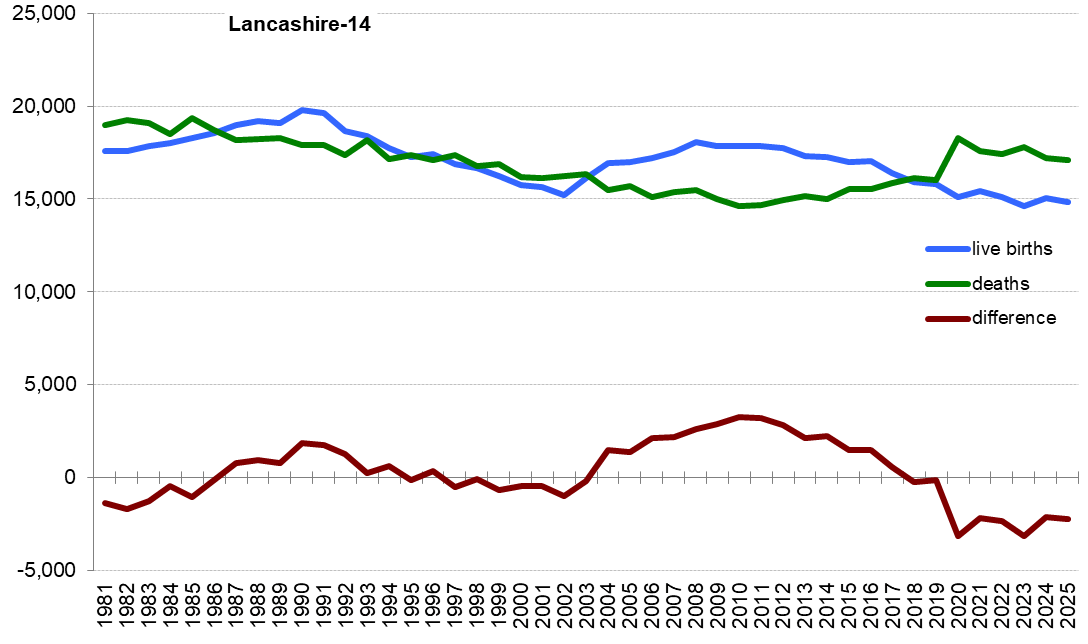
There were 14,834 births and 17,072 deaths registered in the Lancashire-14 area.
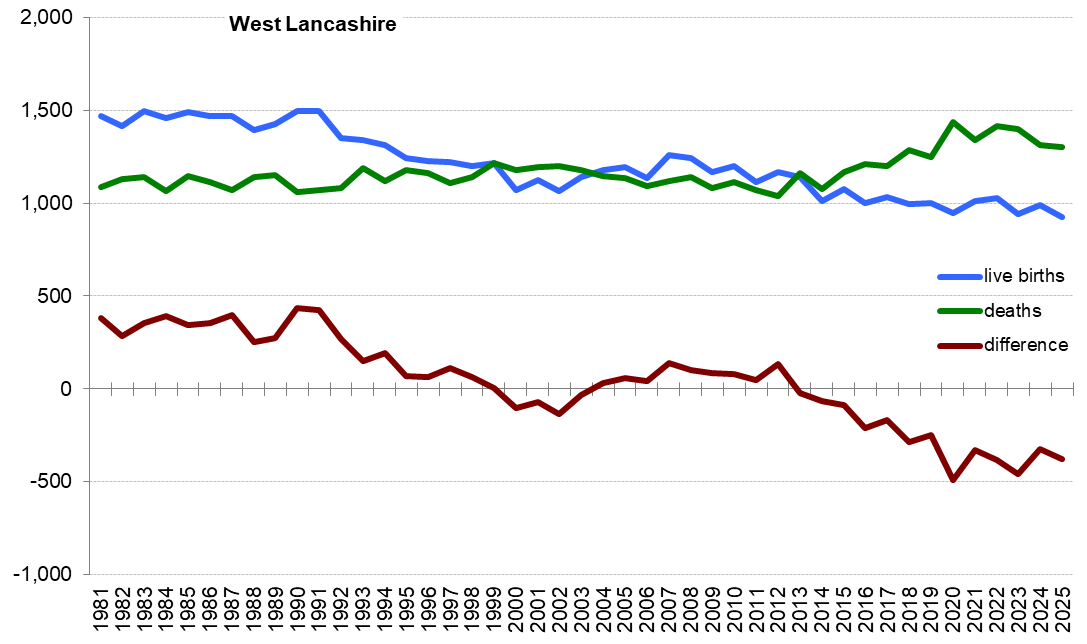
There were more deaths than births registered in both Lancashire-12 (2,298) and Lancashire-14 (2,238) overall, a trend which has continued since 2018.
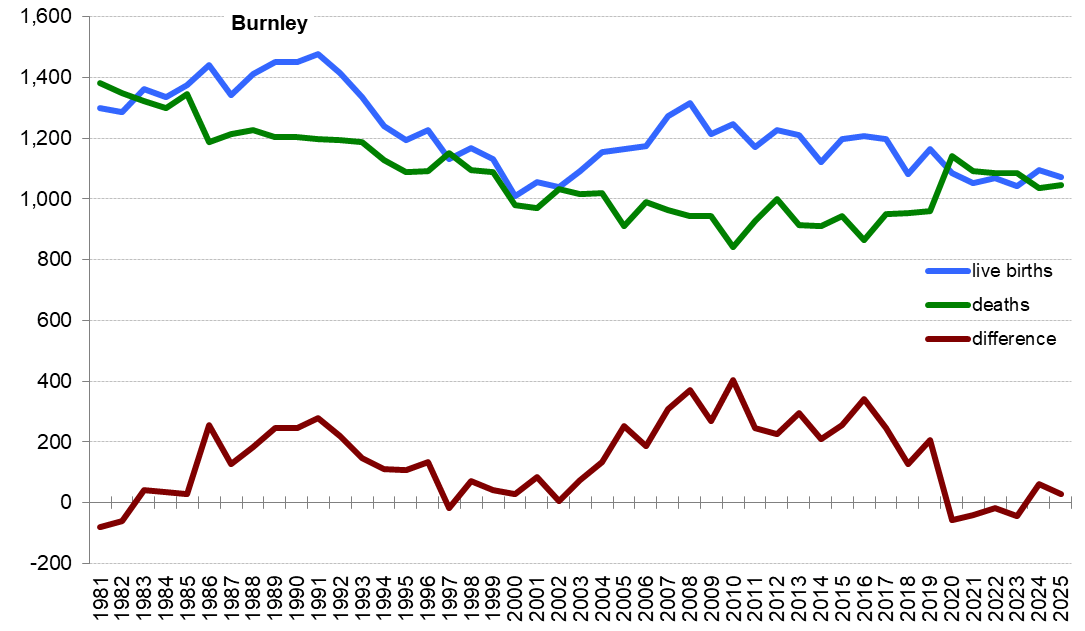
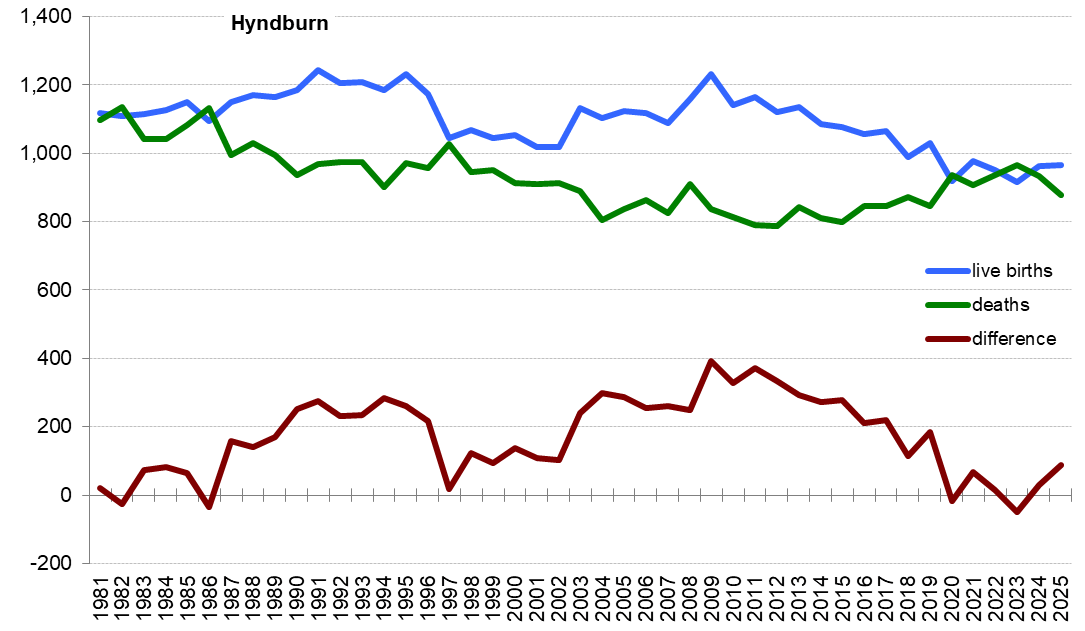
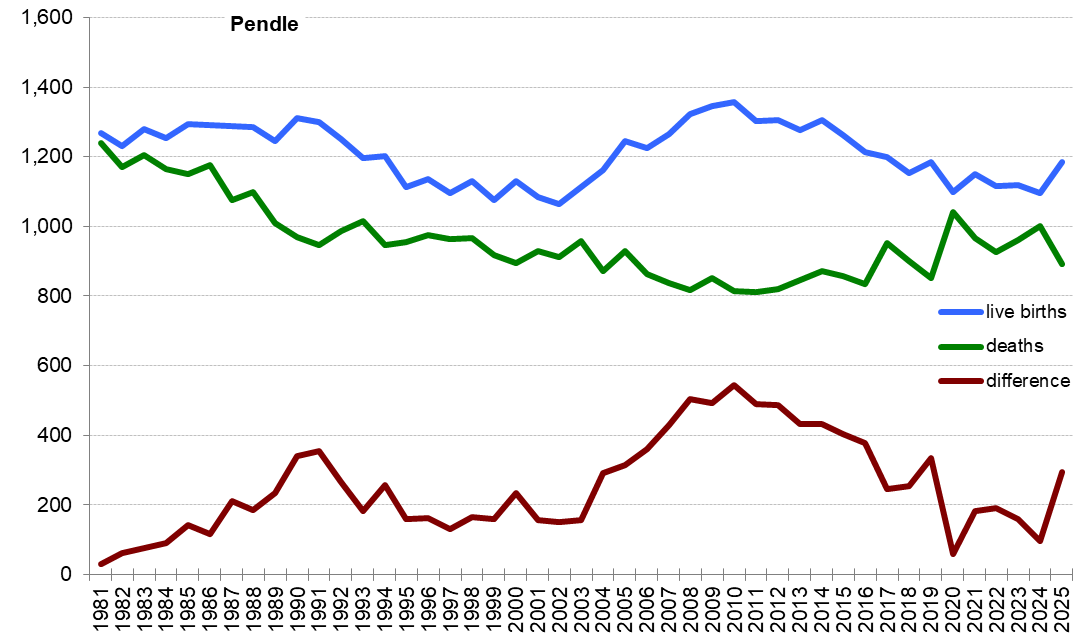
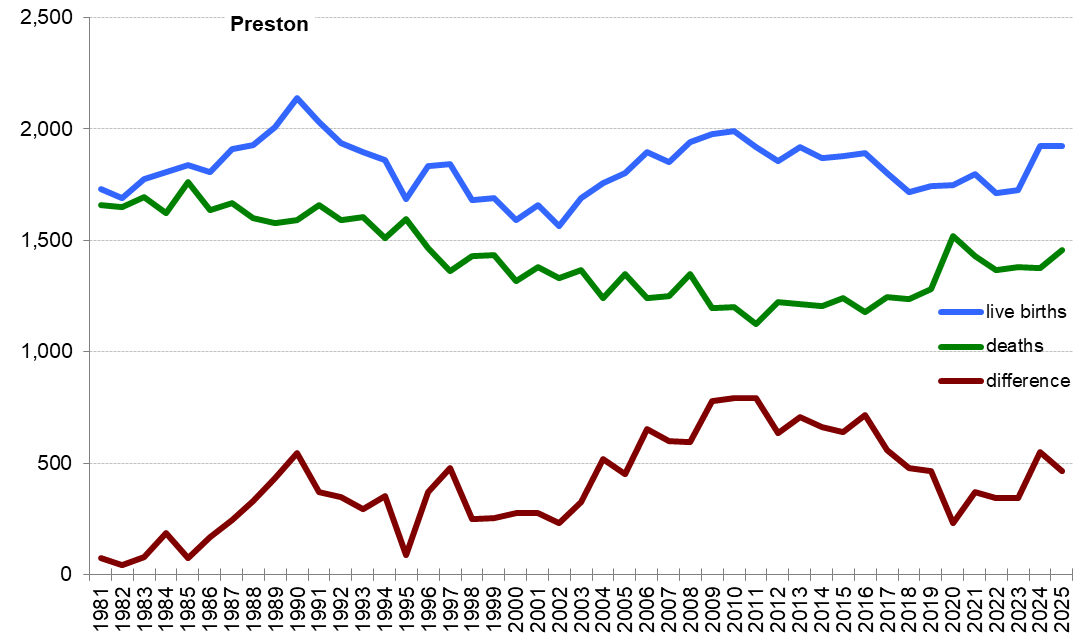
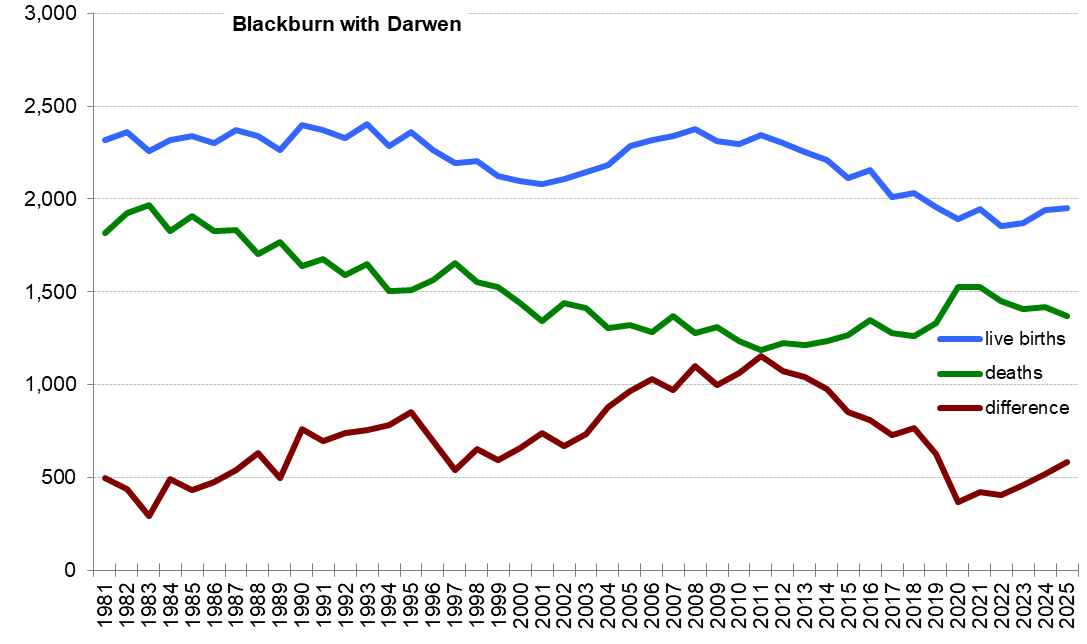
More births than deaths were registered in Blackburn with Darwen (585), Preston (465), Pendle (293), Hyndburn (87) and Burnley (29).
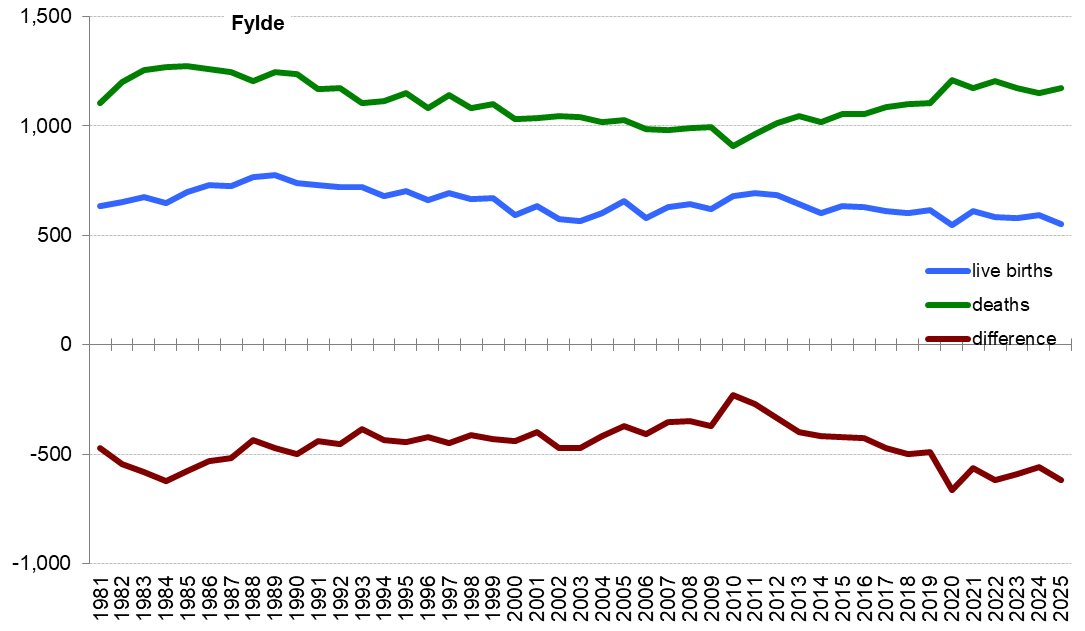
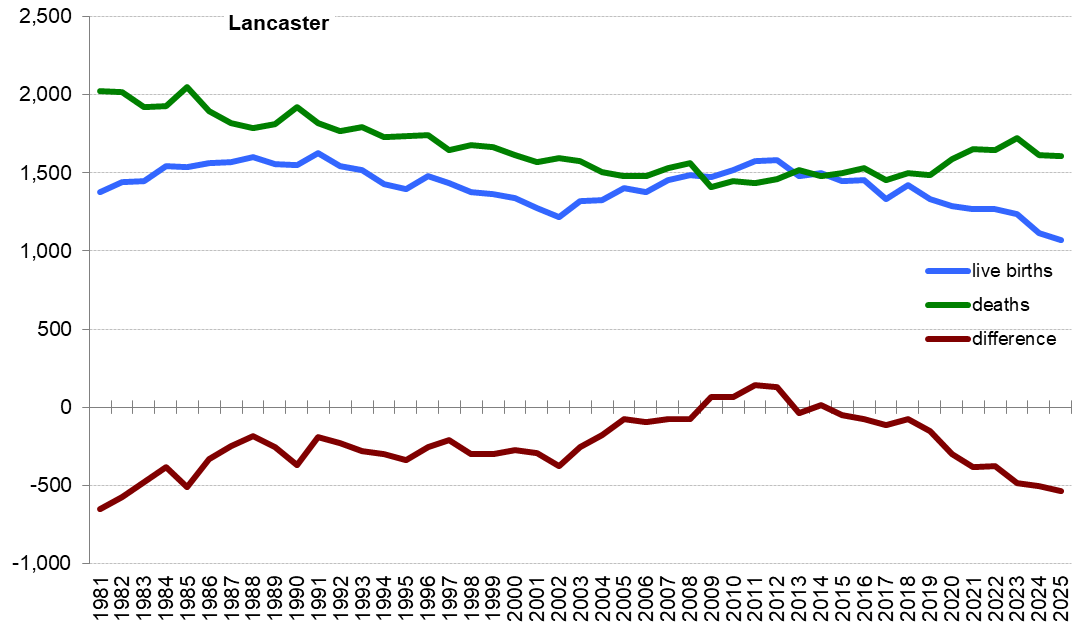
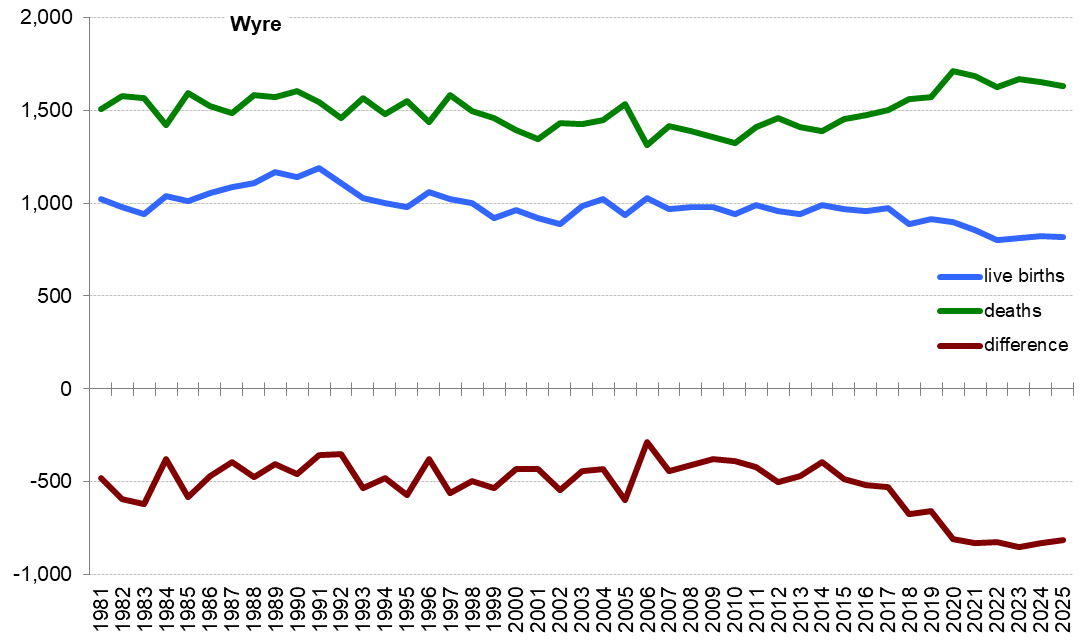
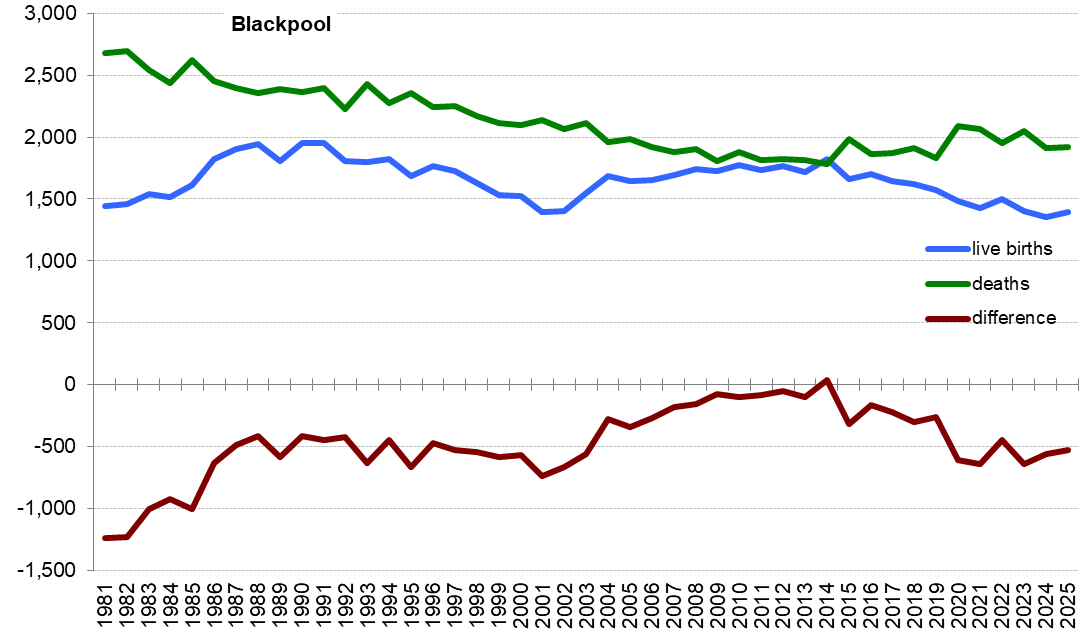
Over 500 more deaths than births were registered in Wyre (812), Fylde (620), Lancaster (534) and Blackpool (525).
Births and deaths in 2025
| Births | Deaths | Difference | |
| Burnley | 1,073 | 1,044 | 29 |
| Chorley | 947 | 1,283 | -336 |
| Fylde | 552 | 1,172 | -620 |
| Hyndburn | 966 | 879 | 87 |
| Lancaster | 1,073 | 1,607 | -534 |
| Pendle | 1,185 | 892 | 293 |
| Preston | 1,921 | 1,456 | 465 |
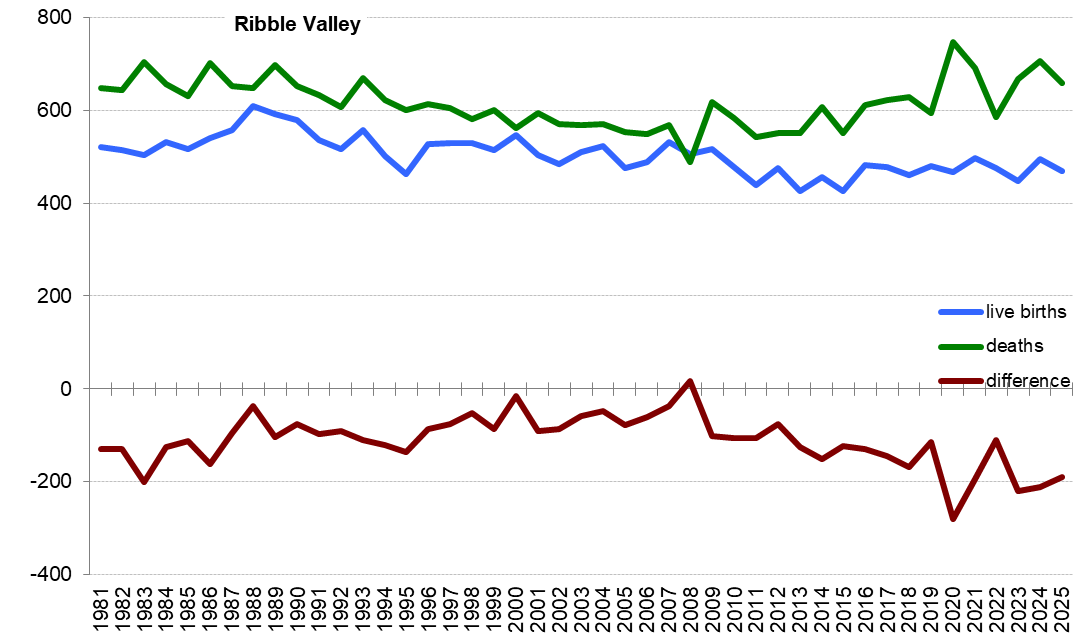
| Ribble Valley | 469 | 659 | -190 |
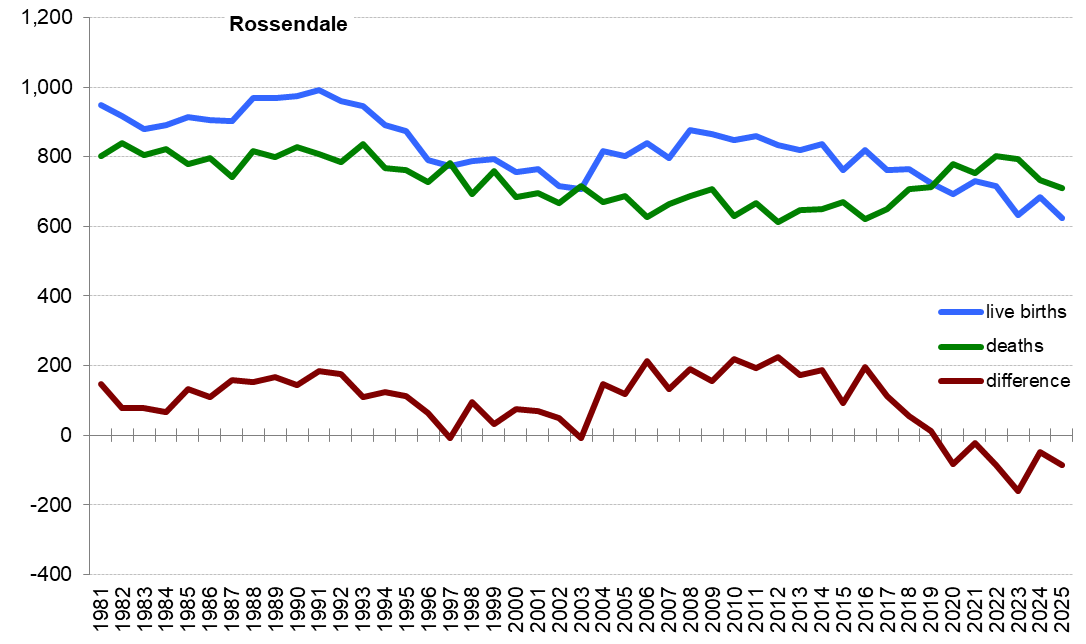
| Rossendale | 625 | 710 | -85 |
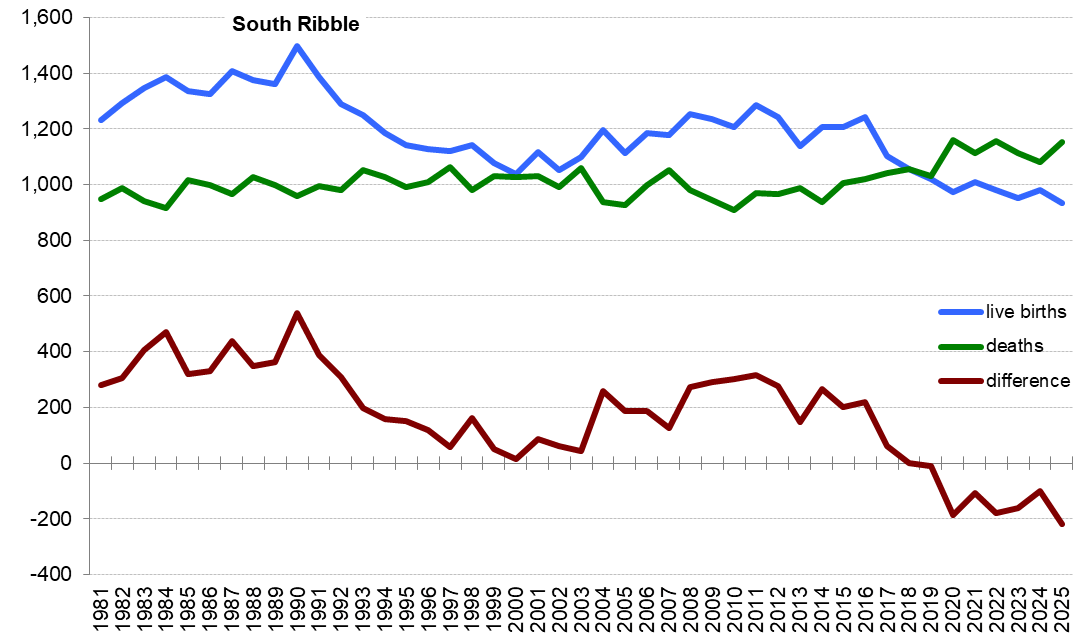
| South Ribble | 933 | 1,152 | -219 |
| West Lancashire | 927 | 1,303 | -376 |
| Wyre | 819 | 1,631 | -812 |
| Lancashire-12 | 11,490 | 13,788 | -2,298 |
| Blackburn with Darwen | 1,953 | 1,368 | 585 |
| Blackpool | 1,391 | 1,916 | -525 |
| Lancashire-14 | 14,834 | 17,072 | -2,238 |
| North West | 73,656 | 76,026 | -2,370 |
| England | 558,988 | 534,048 | 24,940 |
Source: Birth registrations and deaths registered monthly from the Office for National Statistics.
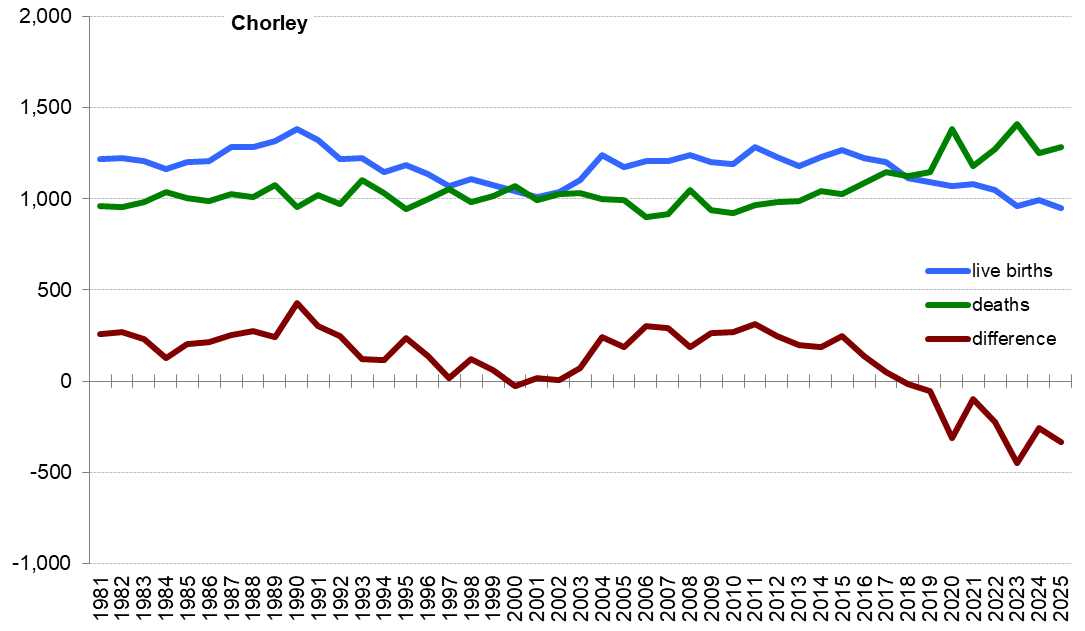
Time series births and deaths graphs (from 1981)
Page updated August 2026