
Employee change
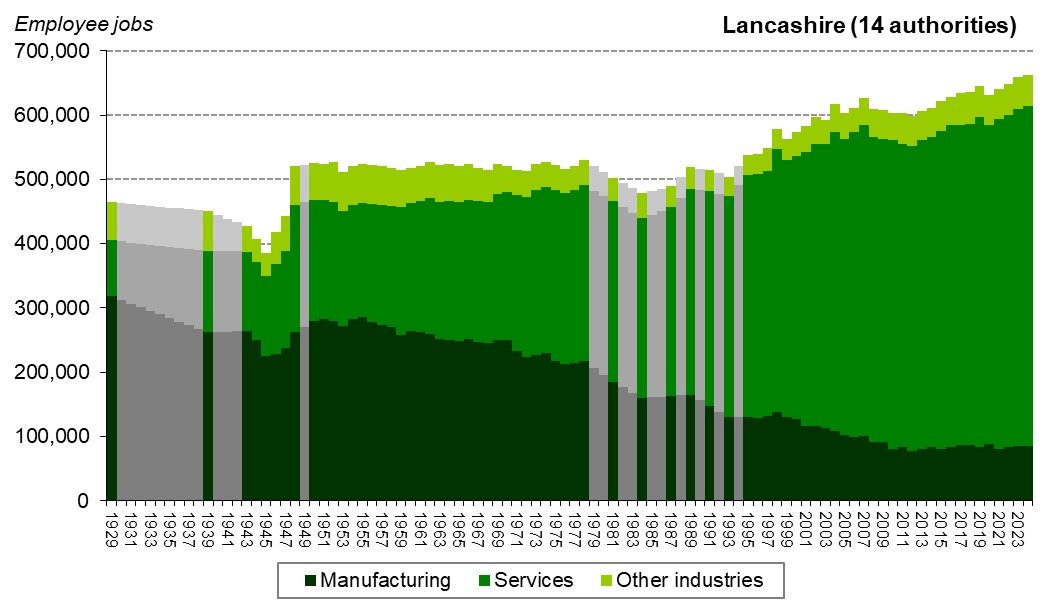
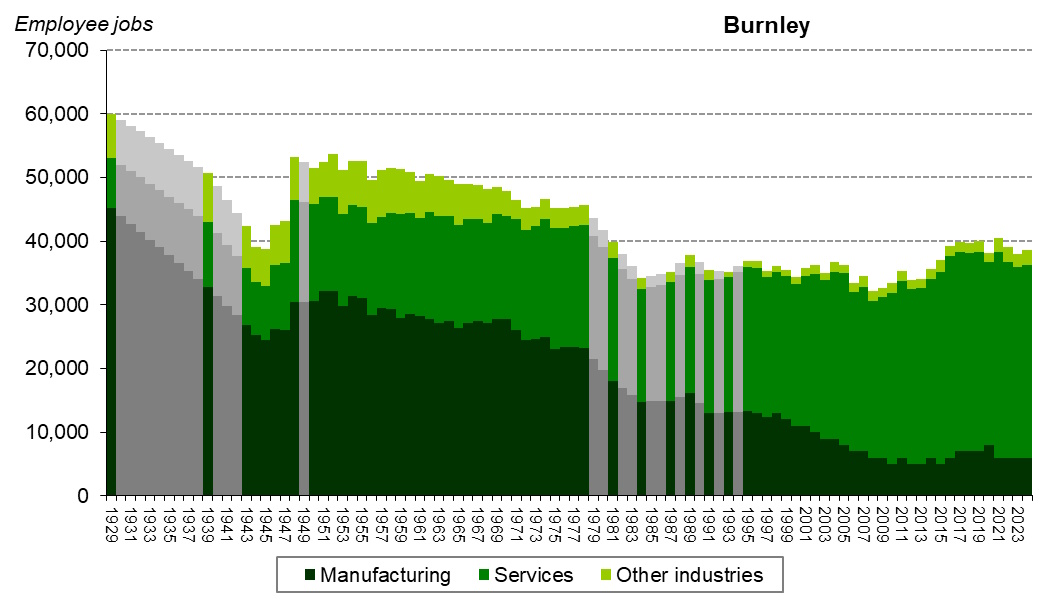
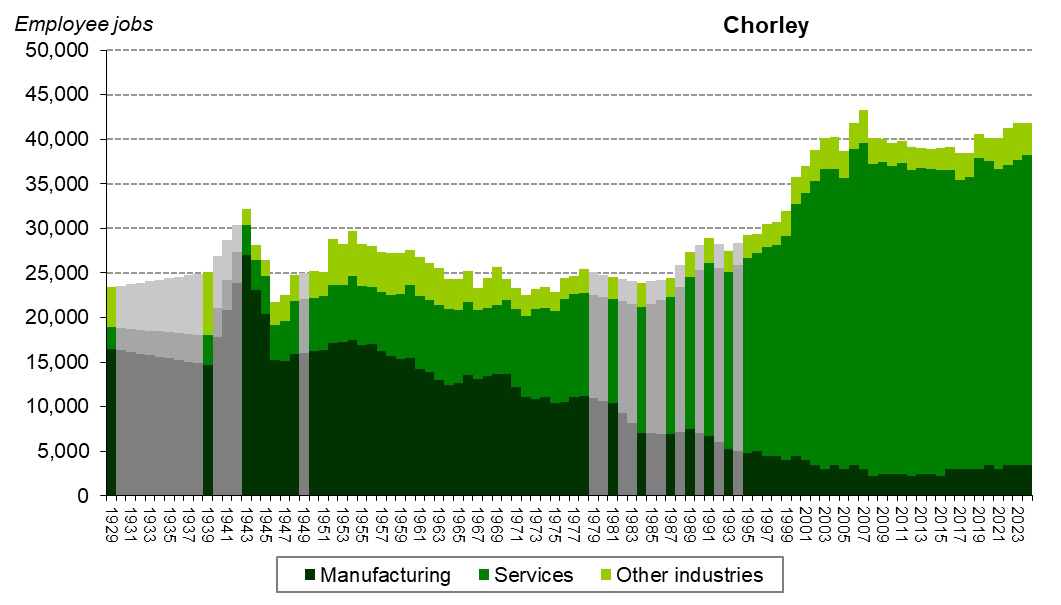
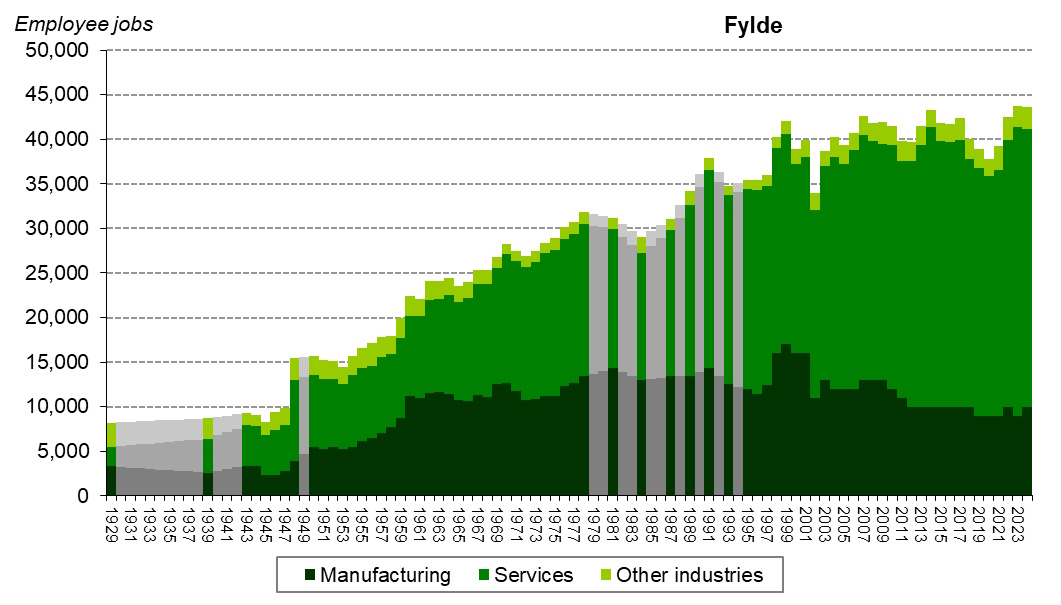
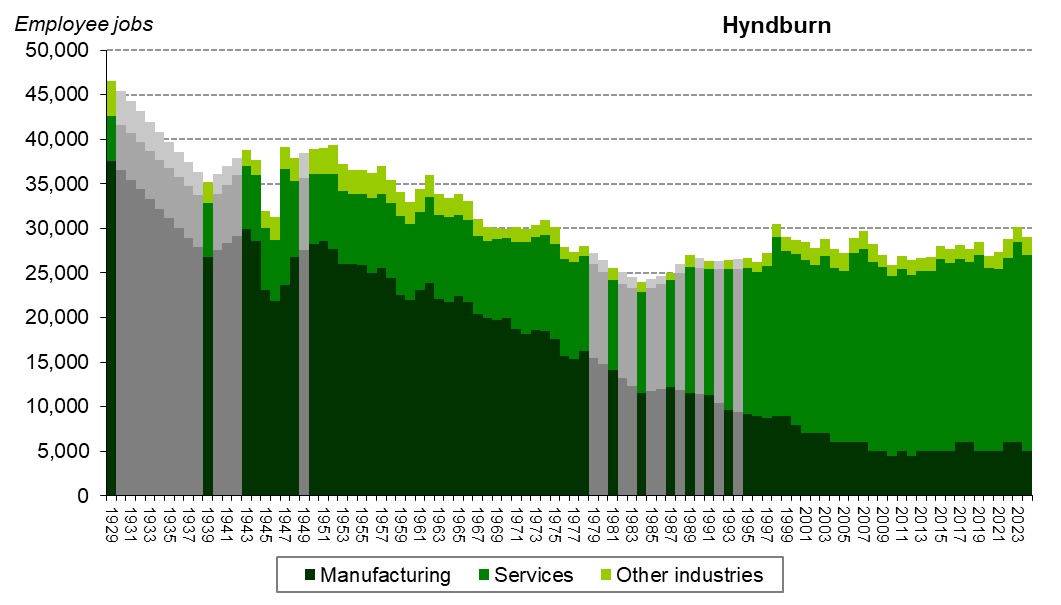
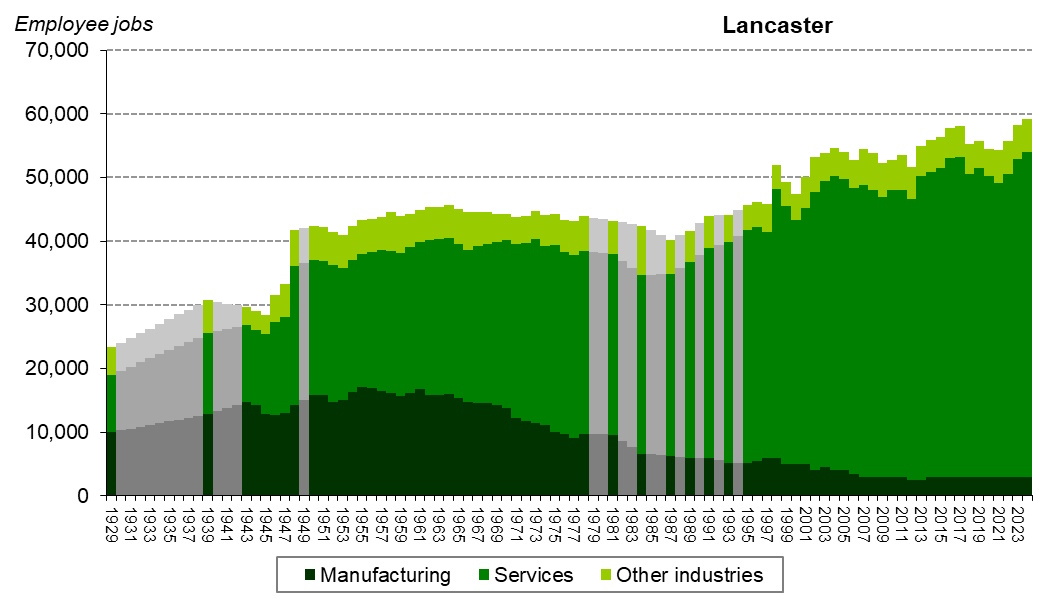
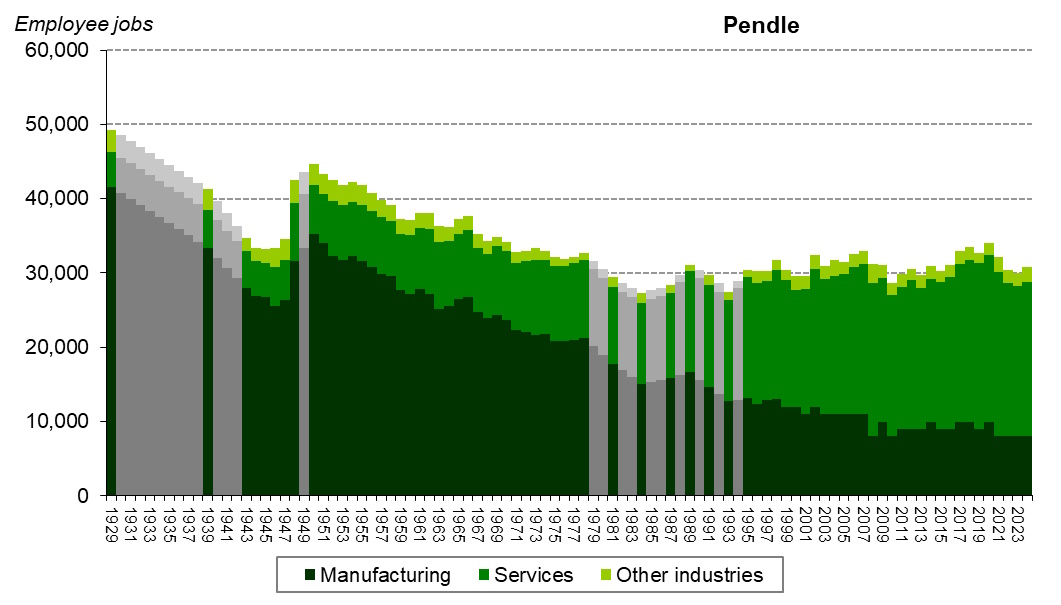
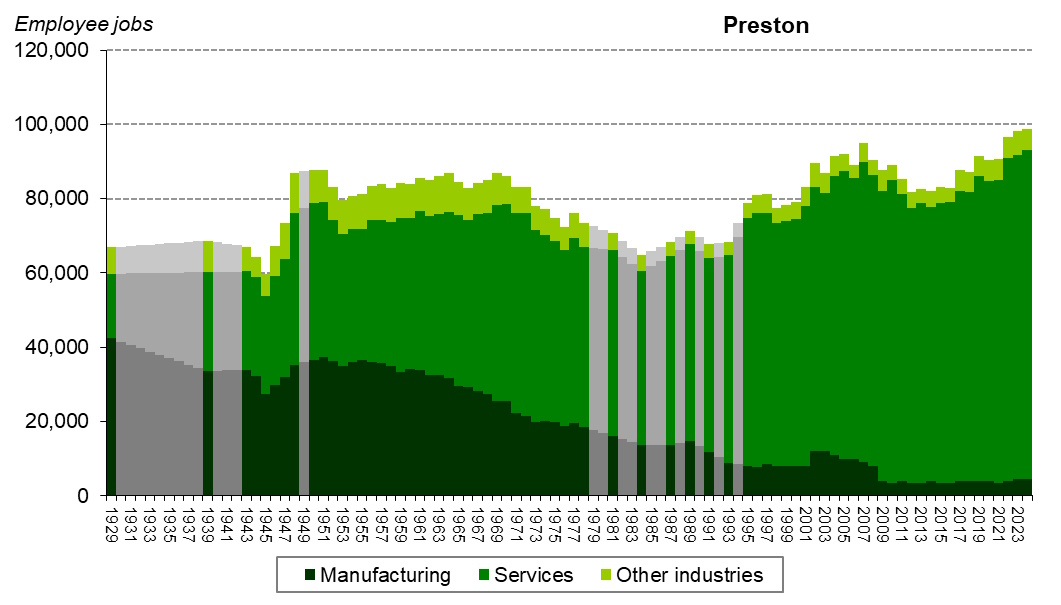
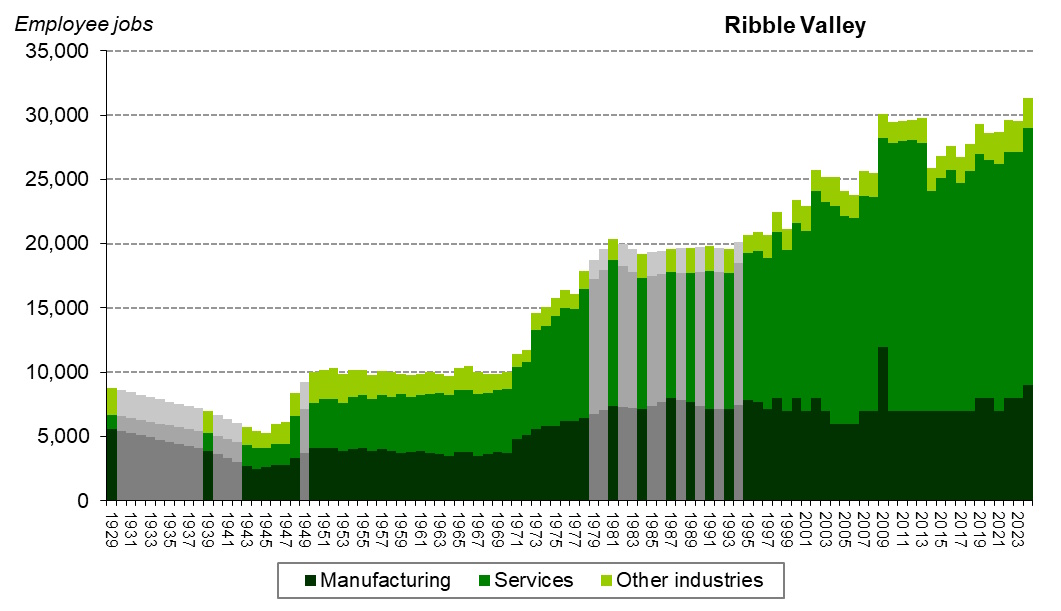
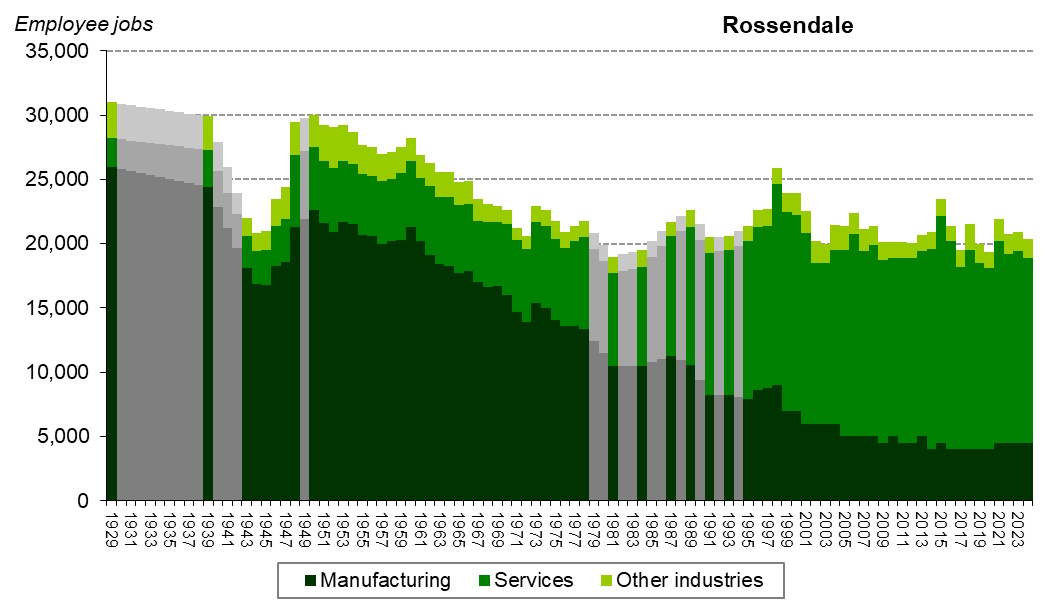
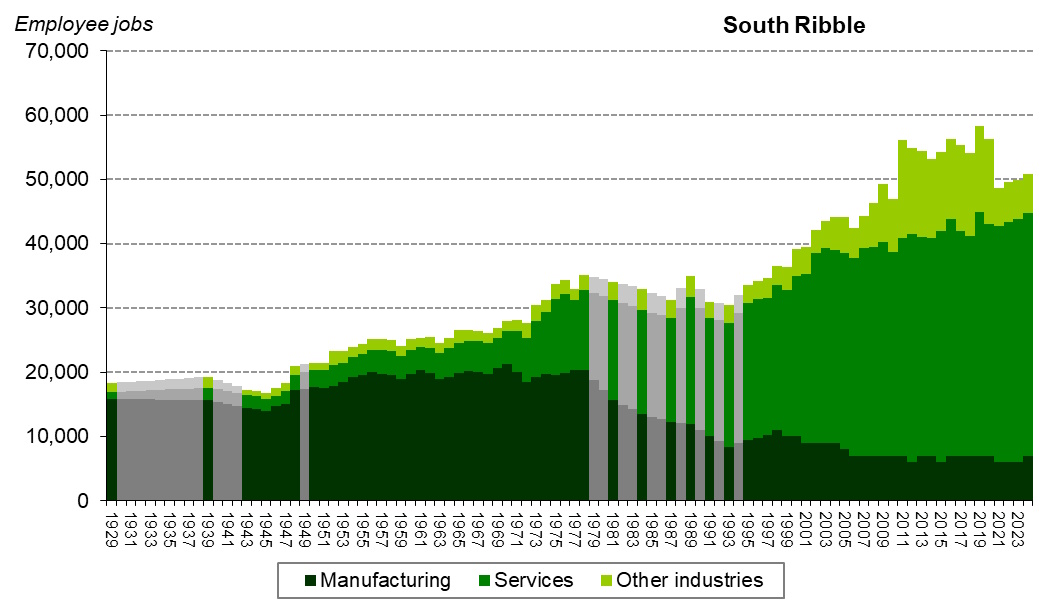
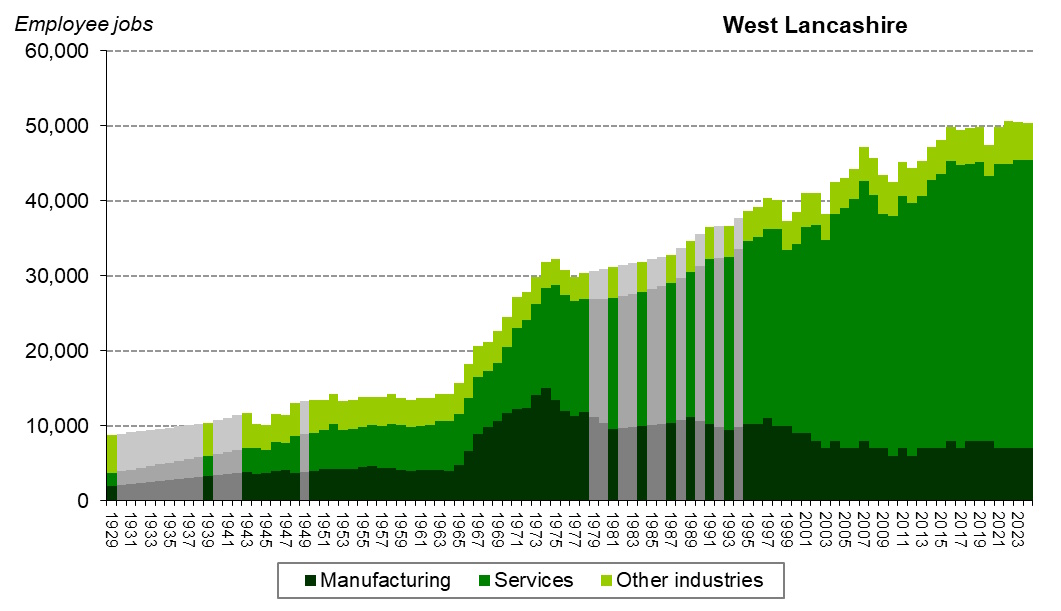
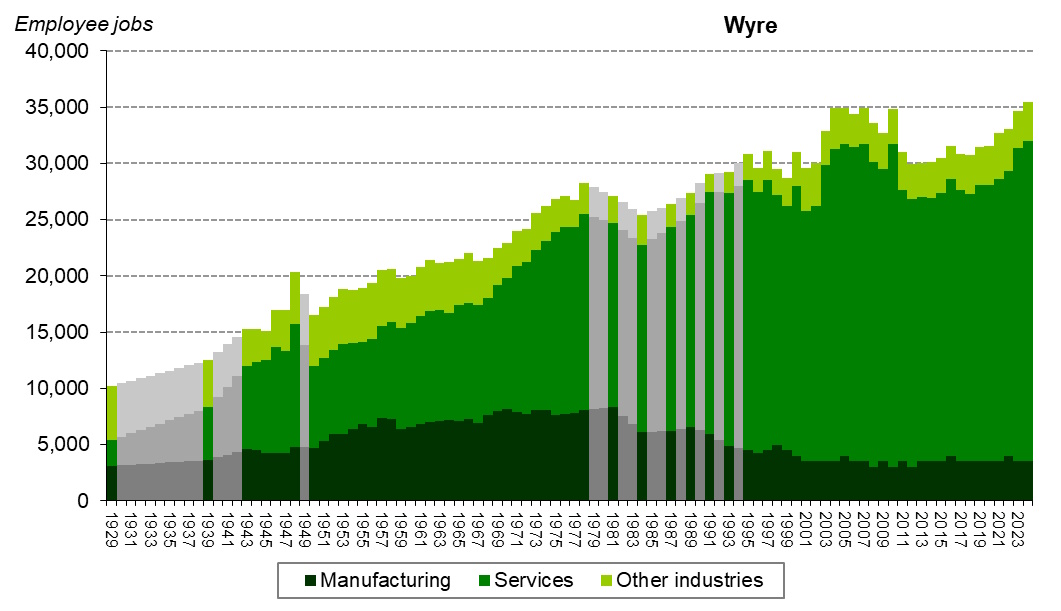
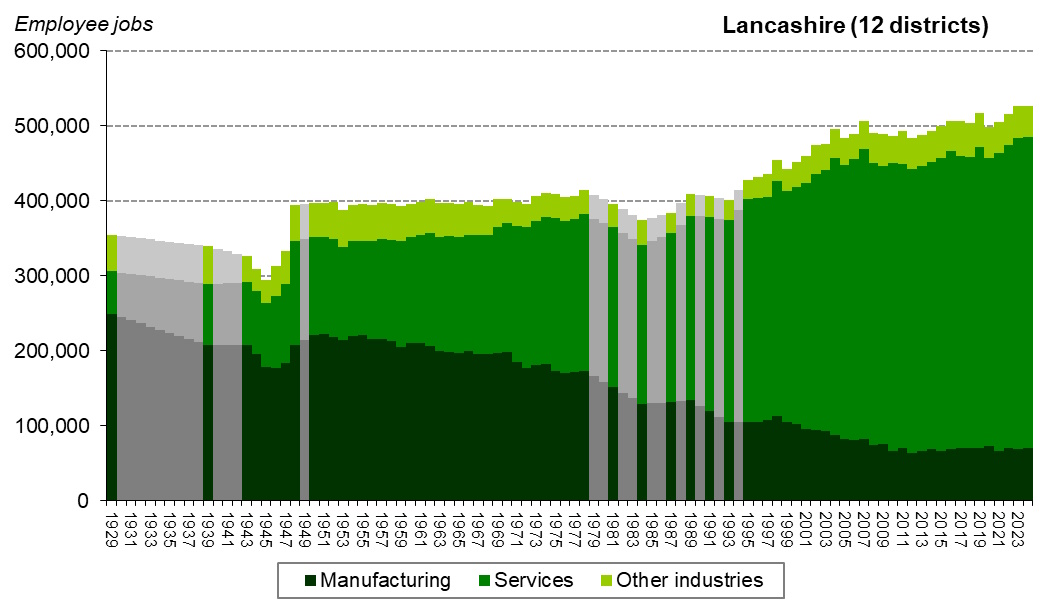
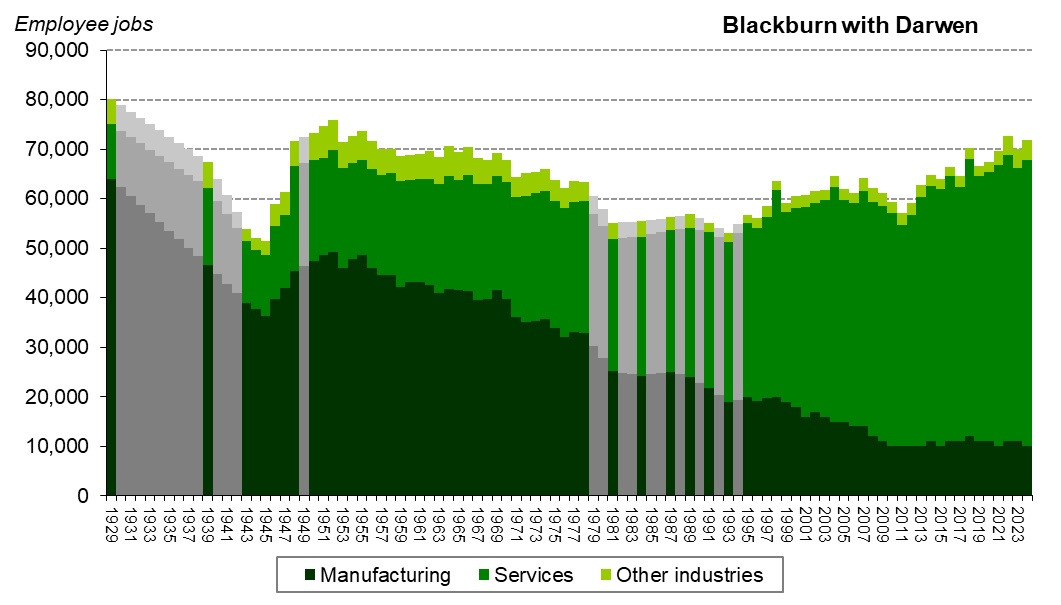
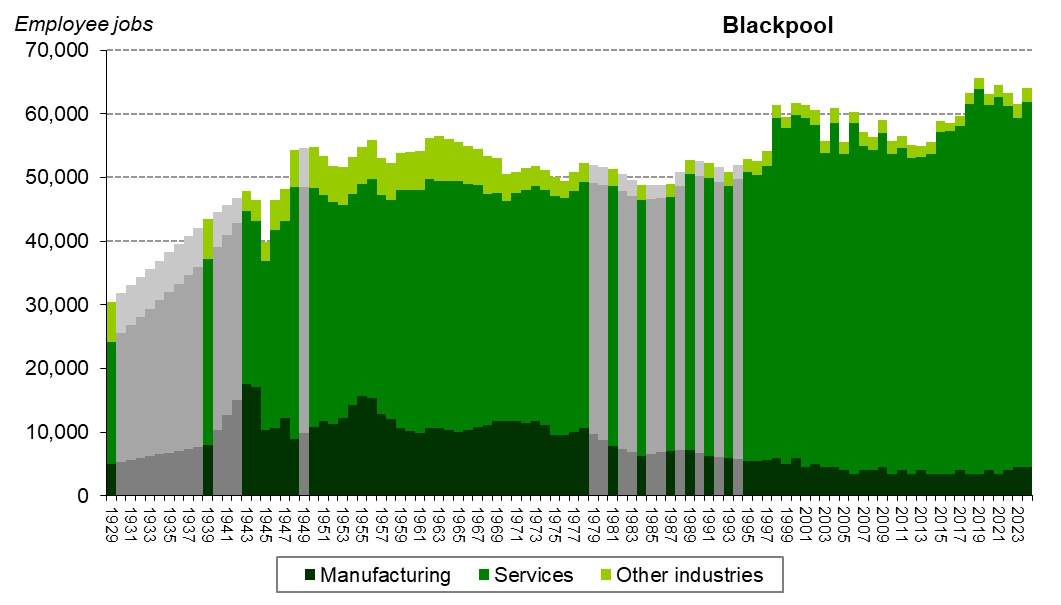
Our extensive employment records allow us to chart the changes in employee numbers from 1929 onwards. On this page we have published separate graphs for each of the 14 Lancashire local authorities plus the Lancashire-12 and Lancashire-14 areas. They all reveal the long-term movements in total employee numbers and the shifts from manufacturing to service sector employment. Although there are common themes that are apparent in all of the graphs, there are some marked variations in different parts of the county that reflect some local specialisms, and especially different rates of change in overall employment.
These graphs exclude the working owners numbers because they have only been available from 2008 onwards. Over the years, there have been a number of methodological changes that will have reduced the accuracy of these long-term comparisons. We have also had to make assumptions for missing years, but the graphs do hopefully give a useful broad indication of changes over time.
Please note that some of the changes in employee numbers over recent years have been the result of administrative changes and not directly attributable to actual changes in physical jobs in the local area. In particular, there was a large administrative movement of jobs from Fylde to Ribble Valley in 2009, however in practice, there was no actual changes in local jobs. This led to a 'spike' in the figure for employees in the manufacturing sector in Ribble Valley during 2009. Up until the previous year the jobs in question (about 5,000) had been allocated to Fylde district, but were not actually present in Fylde. The following year the same jobs were reallocated to the service sector, but stayed in Ribble Valley. In 2014, these jobs were removed from the Ribble Valley total, and this of course led to a large fall in the employment figure for the area. In reality however, there has been no local effect as these jobs reflected the international nature of major contracts and only used an employment location in Lancashire for administrative convenience. A similar effect was seen in South Ribble in 2011 when the number of jobs in the 'other industries' sector more than doubled compared to 2010, then fell back to below the 2010 value in 2021. This spike was driven by the construction sector which became the dominant sector in the district for 10 years. South Ribble was often the only local authority in Great Britain with most jobs being allocated to construction.
The district and unitary authority graphs have also been reproduced as images in each of the local authority profiles.
The graphs are all included below. Click on the different tab headers to display the district, unitary authority or county level.
Figures, Employee change 1929-2024
Page updated March 2026